Skip to content

Author: K33NTester

Testim.io – AI-based platform to quickly author stable tests

What is Testim?

Testim is the first AI-based platform that uses Smart Locators to solve the two biggest challenges in testing—slow authoring and unstable tests. It provides flexibility with options to use their test-grid and or third-party testing grids. (BrowserStack / Sauce Labs). It makes authoring stable tests quick and easy.

Testim’s artificial intelligence Smart Locators make your tests resilient which helps avoid flaky tests.
You can run tests in parallel across browser types on their test grid, or on any Selenium-compatible test cloud such as Browserstack or Sauce Labs.

Video Demo

A demo and overview explaining how easy it is to write a test using Testim.

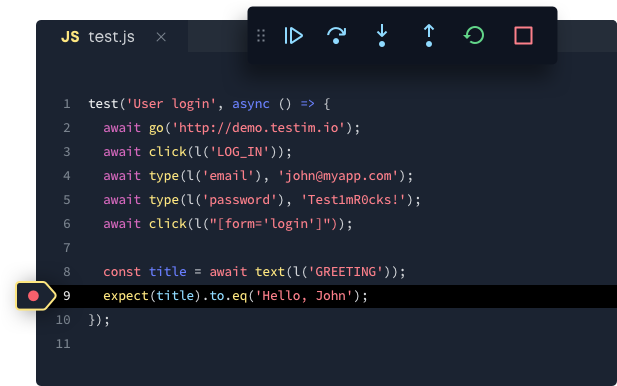
1. Write your tests (Code or Codeless)

Author your tests using Testim’s Record feature (Requires Testim Editor Chrome Extension) or Code your first test with the Testim Dev Kit.

2. Customize your tests

In Testim’s visual editor you can customize your tests or you can do so in your IDE. Some of the examples of what you can do within the Testim UI includes:
Groups, Validations, Conditions, Smart locators, Loops, Data-driven testing, and custom validation and actions.

3. Executing your tests

Executing your tests can be done in three different ways.
Test grid – Testim’s test cloud that allows you to test multiple devices and configurations in parallel.

Cross-browser – Executing your tests across multiple different web browsers and devices to ensure the application at test runs as expected on all supported web browsers.

CI integration – Testim integrates with continuous integration tools so that you can trigger your tests at any time.

4. View Reports

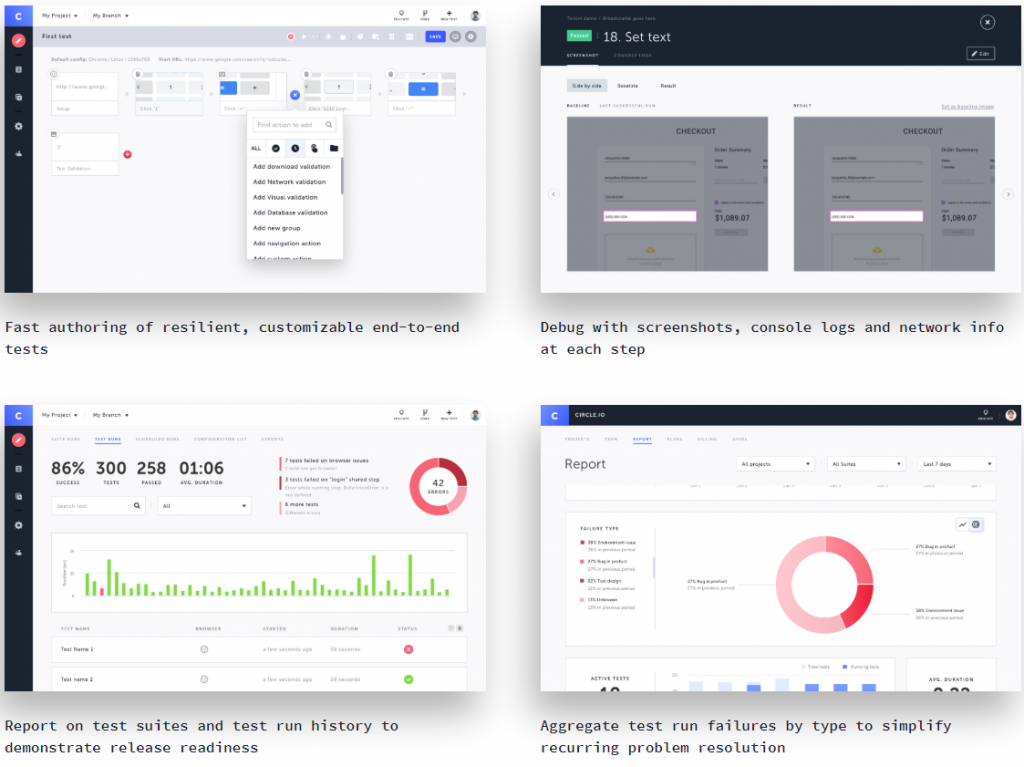
Whether your tests are created with code or codeless, when they run, you can see the results in Testim where you can troubleshoot and capture bugs.
With results including screenshots, console logs, and HTML DOM information Testim makes debugging pretty painless.

Test results can be viewed for an overview or on an individual test suite report level where teams can measure a test suite’s performance and how they are running overtime. Track which builds pass and which builds fail and view individual test runs to view why a test failed.

Find a bug? Well in Testim reporting a bug is really easy. Using the capture tool you can capture a screenshot, video, and or add a description of the error and upload it straight into your bug tracker. (i.e: Jira/Github).

Integrations

Testim works with tools you are likely already using so you can stay in your flow

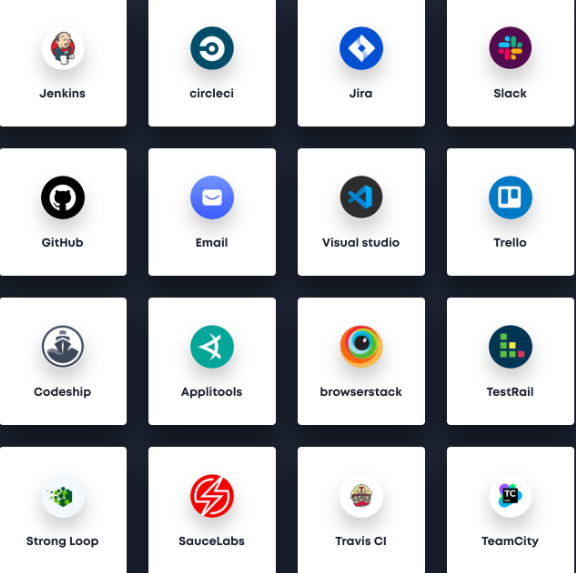
Read more about Testim CI integrations here

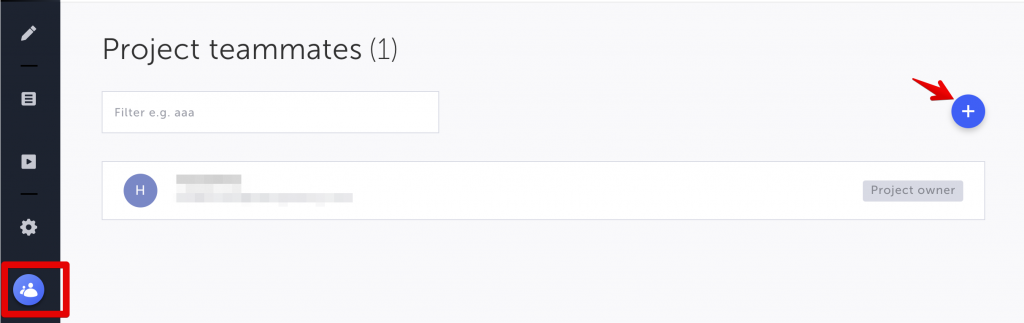
Sharing reports, or giving access to other team members or stakeholders is easy. Simply add their email address to add them as Project teammates and assign their roles.

Add project teammates to collaborate on Testim projects

Cost: Community/Free & Professional/License

Testim community is free and is perfect for smaller teams or those wanting to try AI-based test automation for their web applications. Below is some information regarding the free community and the Professional Testim license.

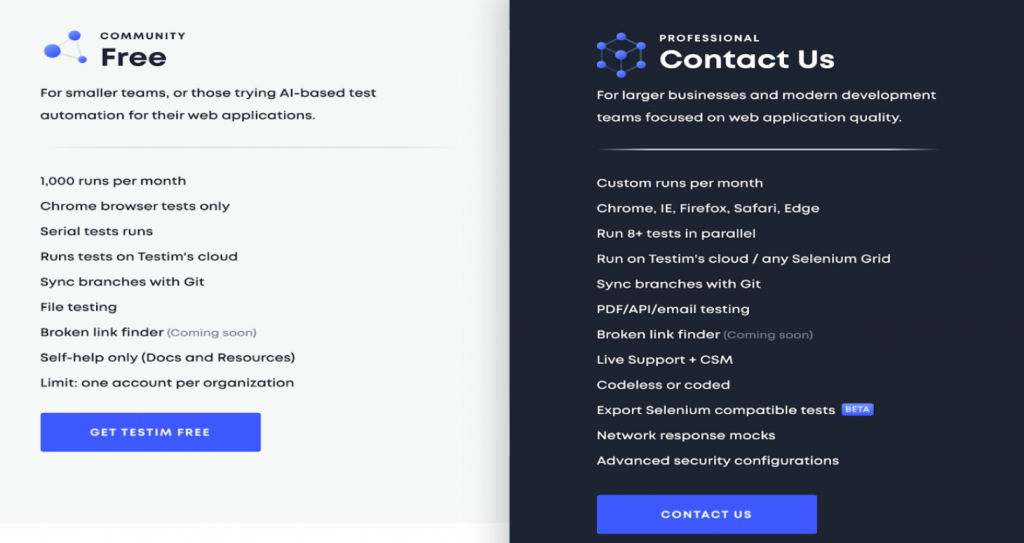
The only downside with the Community/Free version of Testim is that your tests can only be run against Google Chrome and can only run locally or on their Test Grid. The community also comes with 1,000 runs per month which is quite a few runs to get you started.
To get the most out of Testim, and most organizations that may have requirements of all modern-day web browsers would require the Professional license. The professional license supports Chrome, IE, Firefox, Safari, and Edge, but also allows you to use any Selenium Grid amongst the many other features listed above and on the PowerPoint slide deck.

It’s fast and scalable. Testim is not just a record and playback tool like some others you may have seen. Testim is a platform and is incredibly powerful. It tackles the two biggest challenges of being a Quality Engineer/ Test Engineer/ Software tester which is slowly authoring tests and flaky/unstable tests. It’s robust features help you automate tests while also taking care of your tests such as running them locally and on the cloud, integrating with your favorite CI/CD systems, and capturing logs and screenshots of test runs providing you and your team a detailed report. The fact that Testim integrates with so many other third parties really sets it apart from competitors.

Testim gives you the option to write your tests as code, codeless, or both. Another neat feature is that you can export your tests that are written codeless as selenium compatible code. This makes maintaining your tests easier with stable tests. The download code feature is really neat as well. You can record a test, and download the javascript or typescript to edit or run in your favorite IDE.

Command-line interface (CLI)

You can your tests from the command line and integrate it with your CI.
Requirements:
1. Node.js version 10.0.0 or greater
2. Install the Testim package:
npm install -g @testim/testim-cli

The basic CLI of your project can be found on the Settings page of Testim. This includes parameters such as your token and project ID. You can copy the CLI and edit and add parameters to meet your needs.
Some of the common parameters used are:
–project: which project
–token: so we’ll know it’s you
–label: what tests to run
–grid: name of the grid to run the tests on
–report-file: where to put the results (so CI server could read)

Example command:
testim --label "<YOUR LABEL>" --token "<YOUR ACCESS TOKEN>" --project "<YOUR PROJECT ID>" --grid "<Your grid name>" --report-file test-results/testim-tests-report.xml

Learn more about Testim CLI and Parameters here.

Conclusion

I have been using Testim for just over a week now and I must say, it is fantastic! The amount of time I have saved by using Testim just in the past week to write and even rewrite old flaky tests is mind-blowing. The AI Smart Locators Testim uses continues to impress me the more and more I use it. If you have not already given Testim a shot, be sure to check it out Here.

Links


Download Testim Chrome extension
How to record your first Testim test

Using web browser extensions to better your web application testing

Hi, I am K33NTester. In this video, I will be sharing three useful browser extensions/add-ons that are compatible with Google Chrome and Firefox. The extensions mentioned in this video are TruePath, Bug Magnet, and CSS Viewer.

TruePath

TruePath dynamically generates relative XPath on right-click on the web page and displays all the XPath as menu items. Truepath can generate XPath using text value and can create XPath in iFrame or Frames. It also shows the iFrame and iFrame URL so that the user can quickly identify that from which iFrame or Frame the XPath is generated. TruePath also supports the Page Object XPath format or @FindBy. TruePath can also be used with Selenium Page Object locater or Serenity Page Object locater. With DevTool supports, users can easily customize the generated XPath.

It groups the XPath based on:

  • Id, href and src
  • Class, name, title
  • Or Index.

Download :

Learn more about TruePath

Bug Magnet

Bug Magnet provides convenient access to common boundaries and edge cases for exploratory testing. Right-click context menu to help with exploratory testing. It adds common problematic values and edge cases to the context menu (right-click) for editable elements, so you can keep them handy and access them easily during exploratory testing sessions. -It provided convenient access to common boundaries and edge cases for exploratory testing and can be extended easily with your own config files. Bug Magnet works on input fields, text areas, content editable DIVs. It also works on multi-frame pages, but only if they are from the same domain. Tiny overhead per page (1k), no 3rd party library dependencies, completely passive, so it does not interfere with your web app execution in any way. Bug Magnet is also opensource and customizable.

Download:

CSS Viewer

CSSViewer is another extension available for Google Chrome and Firefox. It is a simple open-source CSS properties viewer.

Download:

Using Google Chrome for Testing – Things you may not have known [Part 2]

Hi, I am K33NTester. In this video I will be demonstrating how Google Chrome can be used to capture a web pages performance using the network tab in developer tools, and Google lighthouse audits. Please LIKE and SUBSCRIBE if you enjoyed!
Subscribe here! ► https://tinyurl.com/qtkf45r

Using Google Chrome to simulate devices: Part 1: https://youtu.be/S193G2wGU1U

Follow me on social media @K33NTester:
► TWITTER: https://tinyurl.com/u52yjqb
► INSTAGRAM: https://tinyurl.com/vhpfzjy
► YOUTUBE: https://tinyurl.com/wqwvbwq

Using Google Chrome for Testing – Things you may not have known [Part 1]

Hi, I am K33NTester. In this video I will be demonstrating how Google Chrome can be used as a testing tool and cover inspecting of web elements, the device toolbar, and some simple developer tool console tips. Please LIKE and SUBSCRIBE if you enjoyed!
Subscribe here! ► https://tinyurl.com/qtkf45r

Using Google Chrome to capture page performance and page audits: Part 2: https://youtu.be/MngyERYUOJY

Follow me on social media @K33NTester:
► TWITTER: https://tinyurl.com/u52yjqb
► INSTAGRAM: https://tinyurl.com/vhpfzjy
► YOUTUBE: https://tinyurl.com/wqwvbwq

BlazeMeter: Continuous Performance Testing for Dev Ops

BlazeMeter is a self service load testing platform as a service (PaaS), which is compatible with Apache JMeter. You can read my blog on JMeter here.

BlazeMeter was founded in 2011. It provides developers and teams with the tools necessary using Amazon Elastic Compute Cloud (EC2) service to be able to simulate thousands of users visiting a website simultaneously. From Mobile, to Web applications, web-service, API, or database testing, BlazeMeter can do it all.

What is it Used For?

Like I mentioned above, BlazeMeter can do it all. It is massively scalable, and can test against all of your apps, from web, mobile apps, to microservices, and API. Its fantastic for running Load and Performance Testing in the Cloud. Performance and Load testing is done after the functional testing phase is done, and that is where BlazeMeter comes in handy.

BlazeMeter is the Complete testing suite that leverages open source tools such as JMeter, Gatling, Selenium & Taurus. You can Build using your favorite open source tool, Run any combination of tests in parallel, and View & Analyze test results in real time and automate and configure your tests & integrate with Continuous delivery platforms like Jenkins and Travis.

Build and Run in parallel

Analyze Results in Real Time.


Best used for:

  • Load & Performance Testing
    • Extending JMeter tests (Simulating thousands or millions of virtual users)

Learning Curve:

  • Medium
    • Can be used with and provide better results than JMeter when wanting to simulate 100+ virtual users from 56 geo-locations.

Getting Started with BlazeMeter:

You can write tests as code in domain specific language (DSL) and generate to run JMeter tests without having to leave the BlazeMeter UI. You can also use the same DSL to configure and run tests using any major open source performance testing tool and validate performance of the software at test with every deliver stage.

You can Get Started with BlazeMeter Here.


BlazeMeter Pricing:

The good news is you can simulate up to 50 max concurrent users, and a max of 5 concurrent users for a Selenium Webdriver Test with One shared Load generator. With the Free plan, you can run 10 Tests/Month for a maximum of 20 Mins.

If your just wanting to do Functional API Tests (API Calls), you can run up to 1000/Month with the free tier but the Data/Results will only keep for one week.

For development teams, you can also have Unlimited team mebers with any price tier option for free.

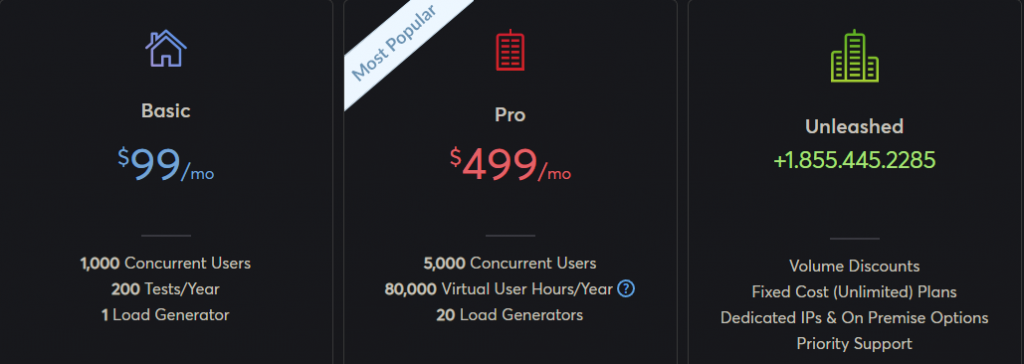
BlazeMeter Annual Cost

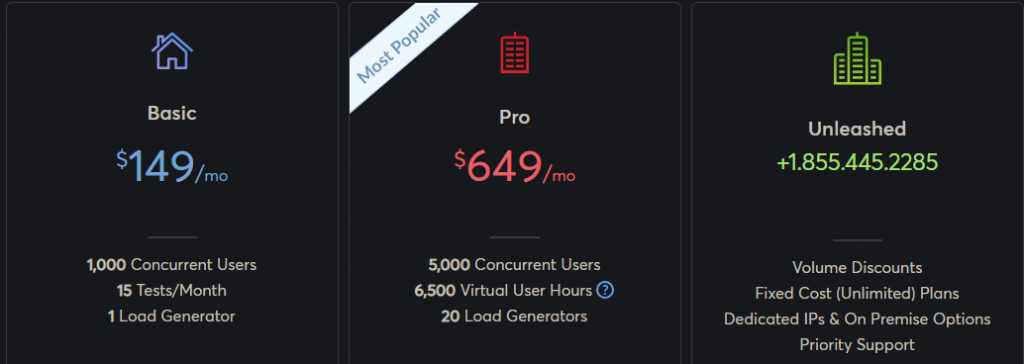
BlazeMeter Month-To-Month Cost

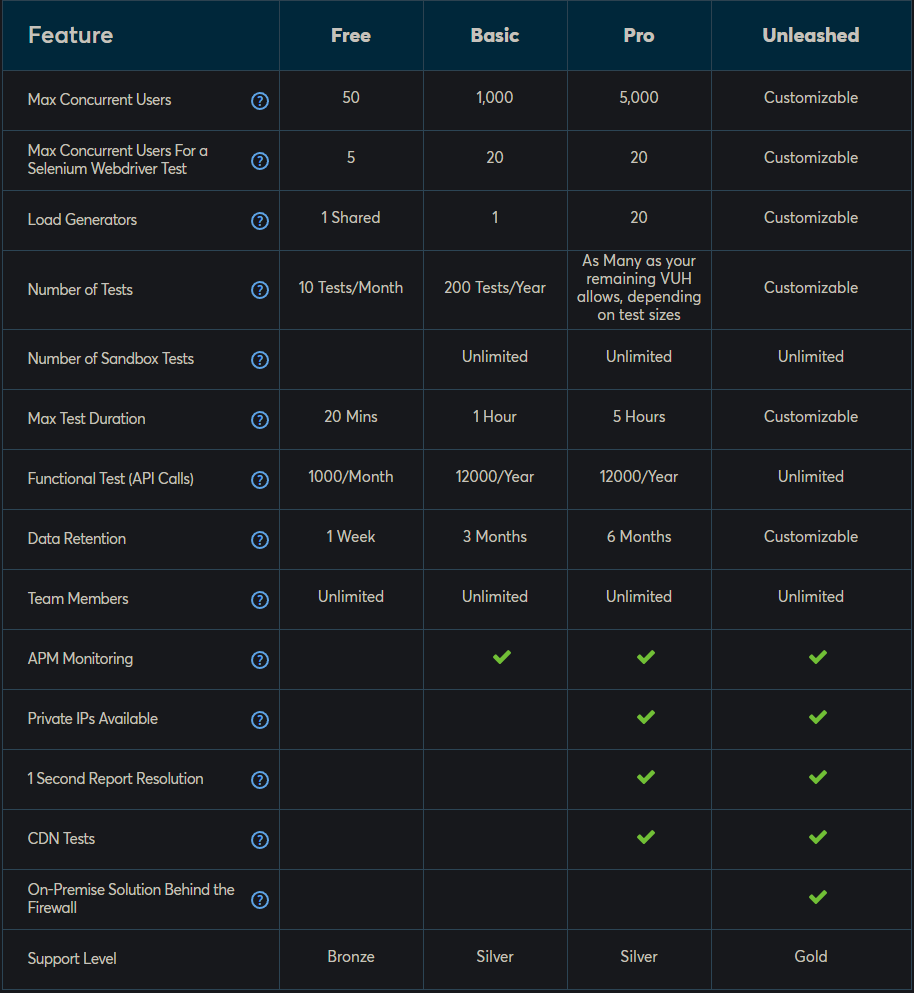
BlazeMeter Plan Comparison

Which Pricing Plan is best for me?

Free – As you can see from the chart above, if you are just needing to perform some Functional API Testing, or run < 10 Tests per month and only need to simulate 50 virtual users, then the Free plan would work just fine for you.

Basic – If you need to run slightly more tests than the Free tier, then the Basic may be for you. It allows for 200 tests/year, 20 concurrent selenium webdriver tests, and comes with the ability to simulate up to 1,000 virtual users. If you are needing to simulate more than 1000 users, then the Pro or Unleashed plans are your better option.

Pro – The Pro plan allows you to simulate 5,000 virtual users. This is the tier that I have previously worked with in Testing Consulting and has worked very well for me personally with the ability to retain Data for up to 6 months, run tests for up to 5 hours long, and use up to 20 different load generators.

Unleashed – The unleashed plan is the 1+ to the Pro plan. The Unleashed plan pricing and is customization if the Pro plan does not meet your needs. You can Contact BlazeMeter for pricing and additional information on the Unleashed plan at: +1.855.445.2285 or Schedule a Demo with a BlazeMeter Engineer.


Closing Thoughts:

I am a big fan of BlazeMeter. As a Software Testing Consultant, I have used Google Postman, JMeter, Insomnia REST, SoapUI, Katalon, and BlazeMeter all for API Testing. BlazeMeter is a very powerful tool when used as an extension to your open source testing tools. For me, I enjoy using BlazeMeter along side my JMeter Tests. As you may know, JMeter can only perform as good as the computer that the application is running on. With BlazeMeter, you can upload your existing written JMeter tests, and run them in the cloud and perform more efficient, and effective load & performance tests. For example, a local machine may only be able to run 100 threads on a JMeter test. With BlazeMeter, you can run thousands, thus providing a better test.

Links:

BlazeMeter Website

BlazeMeter Docs/How-To’s

BlazeMeter Resources

BlazeMeter Pricing Plans

Add the Google Chrome BlazeMeter Extension to your Web Browser

Apache JMeter

Image result for jmeter

Apache JMeter is an application that is open source, and designed to load test functional behavior and measure performance. It was originally designed for testing Web Applications but has since expanded to test even more!


What is it Used For?

JMeter can be used for a variety of things! Its best use though is for performance testing web applications. Using JMeter you can simulate a heavy load on servers, groups of servers, network, or object to test its strength and performance under load.

Apache JMeter features include:

  • Ability to load and performance test many different applications/server/protocol types:
    • Web – HTTP, HTTPS (Java, NodeJS, PHP, ASP.NET)
    • SOAP / REST Webservices
    • FTP
    • Database via JDBC
    • LDAP
    • Message-oriented middleware (MOM) via JMS
    • Mail – SMTP(S), POP3(S) and IMAP(S)
    • Native commands or shell scripts
    • TCP
    • Java Objects
  • Full featured Test IDE that allows fast Test Plan recording (from Browsers or native applications), building and debugging.
  • Command-line mode (Non GUI / headless mode) to load test from any Java compatible OS (Linux, Windows, Mac OSX, …)
  • A complete and ready to present dynamic HTML report
  • Easy correlation through ability to extract data from most popular response formats, HTMLJSON XML or any textual format
  • Complete portability and 100% Java purity.
  • Full multi-threading framework allows concurrent sampling by many threads and simultaneous sampling of different functions by separate thread groups.
  • Caching and offline analysis/replaying of test results.
  • Highly Extensible core:
    • Pluggable Samplers allow unlimited testing capabilities.
    • Scriptable Samplers (JSR223-compatible languages like Groovy and BeanShell)
    • Several load statistics may be chosen with pluggable timers.
    • Data analysis and visualization plugins allow great extensibility as well as personalization.
    • Functions can be used to provide dynamic input to a test or provide data manipulation.
    • Easy Continuous Integration through 3rd party Open Source libraries for Maven, Gradle and Jenkins.

Say you were asked to simulate 200 users hitting an API at one time, how would you do this? Well, JMeter allows you to do exactly that! It would be near impossible to attempt to find 200 people whit a PC and internet access to hit an API at one time right? Well, with JMeter you can do exactly that.

Best used for:

  • API Load & Performance Testing

Learning Curve:

  • Medium
    • Can do more than Google Postman, but is not quite as easy to pickup.

JMeter Advantages

  • Open Source
  • Friendly GUI
  • Platform independents
  • Multi-threading framework
  • Visualize Test Results
  • Easy Install
  • Extensible
  • Multi Protocol
  • Can be used with Blazemeter

How does JMeter work?

JMeter simulates a group of users sending requests to a target. It starts by Sending a request to the target, then getting statistics information of the target, then generates a test report based on the server at test by simulating multiple users sending a request to the target server.

JMeter Plugins

JMeter currently supports 64 plugins. JMeter Plugins can be installed on JMeter using the Plugin Manager.Each plugin serves different purpose.


How do I use JMeter?


JMeter Tutorials

API Testing – A Google Postman Tutorial

So you have an interest in using Postman as your API Testing tool?

Awesome! But before we begin, please be sure to read my blog on Postman found here. 

Let’s get started! First, navigate to my tutorials github repository and download the project.

Here is a very basic Postman tutorial for testing and training purposes. This repository contains the following files: The Postman Collection(PostmanTutorial.postman_collection), The Data File( postman.data.json), and this ReadMe file.

Requirements:

Instructions:

  1. Download/Clone this repository.
  2. In a new Terminal window, navigate to your newly downloaded/cloned postman-tutorial project.

Running the Collection:

  1. In a new Terminal Window, Navigate to the folder containing the PostmanTutorial.postman_collection and the postman.data.json files. (cd into the project directory).
  2. Run $newman run PostmanTutorial.postman_collection --insecure -d postman.data.json

Editing the Data Tested:

  1. Open the postman.data.json file in your preffered IDE, notepad or terminal window.
  2. Make edits, save, and ReRun the collection.

Editing Tests:

  1. Open Postman
  2. Once Postman is open, On the Top Navigation Bar, click Import
  3. Import the PostmanTutorial.postman_collection file.
  4. Navigate to your newly imported PostmanTutorial collection in Postman.
  5. Click Tests to view the Tests for the collection.
  6. Click Save to save your changes.
  7. Hover over your Postman Collection name and click the three dots ()
  8. Cick Export
  9. Select the Collection v2 option and click Export
  10. Save to the same folder location and overwrite PostmanTutorial.postman_collection.
  11. Run your Collection.

Generating Run Reports:

  1. Install newman html reporter by doing a $npm install -g newman-reporter-html in a terminal window.

Usage:

In order to enable this reporter, specify html in Newman’s -r or --reporters option.

  • Example: $newman run PostmanTutorial.postman_collection --insecure -d postman.data.json -r html

API Testing & Google Postman

Google has always been one of the leaders in the tech industry and although there are many different options when it comes to selecting the best API testing tool, Google’s Postman still is at the top of my list and here is why.

What is an API?

Great question! So, in computer programming, an application programing interface (API) consists of a subset of definitions, communication protocols, and tools for building software.

Basically what this means is that a set of clearly defined methods of communication amongst various components. This could be a web-based system, Operating system, database system, computer hardware, or even a software library.


What makes a “Good” API?

A good API makes development easier. Think of it as the rock, or the foundation of a project. You need a solid base foundation and building blocks the piece together the end result, right? Same goes for API and programming.


What is Google Postman?

Google Postman “makes API Development simple, developers use Developers use Postman to build modern software for the API-first world.”

Not only can Postman be used for developing an API, it can also be used for Testing an API.

Google Postman Features

Postman’s Tools Support Every Stage of the API Lifecycle.

Postman Cost – FREE!

The best thing about Postman is that it is completely free! I have used Postman for a few years now and have never had a problem with the Free version and have used Postman for testing multiple API’s.


How can I use Google Postman for API Testing?

Google postman can be used for API testing in a variety of different ways. For example, you can have a simple status check on a website’s Url that runs on a monitor schedule and runs at the top of every hour, and can even notify you when a website is unreachable with the ability to check HTTP Status Codes.

You can also test a REST API’s response body to verify that the API is providing the expected request response.


Example Postman Tests:

// Status Code Tests:

if(tests[“Status code is OK/200 and receiving a response as expected”] = responseCode.code === 200) {

   // Response Assertions/Status Checks

   pm.test(“Status code is OK”, function () {

   pm.response.to.have.status(“OK”);});


   pm.test(“Response time is less than 800ms”, function () {

   pm.expect(pm.response.responseTime).to.be.below(800);});


   pm.sendRequest(“https://postman-echo.com/get”, function (err, response) {

       console.log(response.json());});


   pm.test(“Content-Type is present”, function () {

       pm.response.to.have.header(“Content-Type”);});


// Error Checks:

   pm.test(“Response should be okay to process”, function () {

   pm.response.to.not.be.error;

   pm.response.to.have.jsonBody(“”);

   pm.response.to.not.have.jsonBody(“error”); });


// Response Body Content Tests:

   pm.test(“Response contains A String”, function () {

       pm.expect(pm.response.text()).to.include(“ExpectedResponseStringHere”);});

}


The above Example is of possible Test Scripts that can be written to test API’s using Postman. The Status Code Tests are testing that the response was Status Code 200 (Ok) and that the Response was received in less than 800ms/0.8 seconds.

The Error checks are checking that the response should be okay to process and is a .json as expected.


The final test is testing that a Specific String from the Response Body is included in the API’s response.

View Postman Test Scripts for more information.

Postman Review

Overall I am incredibly happy with Postman and everything that it can do in terms of being able to Test an API. Postman has a fantastic UI and is easy to learn and use for beginners. With the ability to automate scheduled runs and checks on API’s it makes testing easy and powerful. Postman’s free option is all that is needed when testing an API. If you are new to API Testing, and wanting to get your feet wet, I strongly recommend you give Postman a try.

Links:

Download Google Postman

A How-To test using Postman Tutorial

Getting Started with Google Postman


iOS 12 is Here!


 wwdc 18 announcements


Download the iOS 12 Beta Profile for your device Here.

Watch the Apple 2018 Keynote WWDC18 Here.

iOS 12

Image result for ios 12iOS 12 Release Date

iOS 12 Supported Devices:

  • iPhone X
  • iPhone 8
  • iPhone 8 Plus
  • iPhone 7
  • iPhone 7 Plus
  • iPhone 6s
  • iPhone 6s Plus
  • iPhone 6
  • iPhone 6 Plus
  • iPhone SE
  • iPhone 5s
  • 12.9-inch iPad Pro 2nd generation
  • 12.9-inch iPad Pro 1st generation
  • 10.5-inch iPad Pro
  • 9.7-inch iPad Pro
  • 10.5-inch iPad
  • iPad Air 2
  • iPad Air
  • iPad 5th generation
  • iPad mini 4
  • iPad mini 3
  • iPad mini 2
  • iPod touch 6th generation

This means that all devices that run iOS 11 can run the iOS 12 beta. This means that the oldest Apple devices that can support iOS 12 will be the iPhone 5s and iPad Air.

Key Takeaways:

  • Apps will launch 40% faster, the keyboard launches 50% faster, and even the camera comes a lot faster, up to 70% on older devices.
  • ARKit 2, and new iOS Applications (Measure, iPad Stocks)
  • Facetime
    • Ability to group chat with up to 32 people.
  • Animojis (Also called Memoji)
  • Photos
    • Photos app have received a face-lift with a new For you tab, event search, sharing suggestions, and smarter search suggestions.
  • Camera
    • Portrait mode has been improves as well as the QR code reader. There is an API available for developers to seperate layers in a photo so they can do their own portrait modes and other special effects.
  • Notifications
    • Notifications will now be grouped together by app. You can choose to have notifications for particular applications delivered silently and make more critical alerts display even while in Do Not Disturb mode. wwdc18 notifications
  • Apple FaceTime will also get Animoji and Sticker packs apple wwdc 2018 memoji tim cook
  • Do Not Disturb Mode (DND Mode)
    • During DND, your notifications will be in the background and not be displayed on the lock screen until DND Mode is turned off. Users can set DND end time during an event, for a set location, time, ect.
  • Apple CarPlay Update
    • Apple CarPlay will now support third-party navigation applications
  • Apple Books and new Stocks App

MacOs Mojave with dark mode


  • Users will be able edit screenshots, use Mark-up straight after taking one. There is also the option of capturing the entire screen, and the option for screen capture for video.
  • Users can invoke mark-up in PDF documents in the Quick Look options. It will work for all kinds of files, including PDFs, videos, etc.
  • Stacks will ensure you desktop is cleaner and not one giant mess of all different kinds of files. It will stack them according to kind, tags, etc. Sidebar in Mojave supports all metadata for photos. There are also quick actions in the photos app. Sidebar is also available in other views in the Finder app as well.

Apple tvOS 12 for Apple TV with Dolby Atmos support

Apple says iTunes has the largest 4K HDR library. Apple TV 4K will now add support for Dolby Atmos for ‘room-filling sound.’

 WatchOS 5 announcement

  • Users will no longer have to say Hey Siri to the Apple watch.
  • WebKit is being brought to watchOS 5 and will support web content on the Apple Watch itself. Apple Podcasts app will also be coming to the Apple Watch.

watchOS 5 brings Walkie-Talkie feature to Apple Watch

My personal thoughts on iOS 12 in the last 24 hours:

It is fantastic! It is honestly probably more stable than last years final iOS 11 release. No joke! My personal iPhone 6 is currently running iOS 12 Beta and all apps open and run noticebly faster and respond much quicker! So far, so good!

Microsoft + GitHub

Yesterday, June 4th, 2018, it was announced that Microsoft has acquired GitHub. GitHub is the world’s leading software development platform.

28 million developers already collaborate on GitHub, and it is home to more than 85 million code repositories used by people in nearly every country.

Chris Wanstrath (left), Github CEO and co-founder; Nat Friedman, Microsoft corporate vice president, Developer Services; Satya Nadella, Microsoft CEO; and Amy Hood, Microsoft Chief Financial Officer.

I personally have used GitHub and prefer GitHub as my preferred choice of code repository over others.

I hope that this does not become like Micrsofts Skype / VSTS!


Read Microsoft’s Blog post about Microsoft + GitHub = Empowering Developer Here.